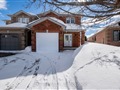
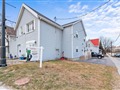
59 Westmount Dr N Dr
$738,101
Comparative Market Analysis
Jul 1, 2025
NOT AN ACTIVE LISTING
Historical Performance
| Period | $ Change | % Change |
| 1 Day | +$265 | +0.036% |
| 7 Days | +$485 | +0.066% |
| 30 Days | -$126 | -0.017% |
| 3 Months | +$797 | +0.108% |
| 6 Months | +$17.6k | +2.45% |
| 1 Year | -$19.2k | -2.54% |
| 3 Years | +$182k | +32.6% |
| 5 Years | +$305k | +70.4% |
| 10 Years | +$467k | +172% |
List My Property
Real Estate Statistics
Financing Solutions
AS SEEN ON


Are You a Licensed Real Estate Agent or Broker?