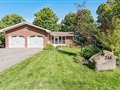
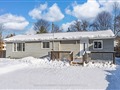
46 Dancy Dr
$836,450
Comparative Market Analysis
Jul 1, 2025
NOT AN ACTIVE LISTING
Historical Performance
| Period | $ Change | % Change |
| 1 Day | +$300 | +0.036% |
| 7 Days | +$297 | +0.035% |
| 30 Days | -$1,392 | -0.166% |
| 3 Months | -$3,247 | -0.387% |
| 6 Months | +$11.1k | +1.35% |
| 1 Year | -$43.4k | -4.94% |
| 3 Years | +$128k | +18.1% |
| 5 Years | +$227k | +37.1% |
| 10 Years | +$441k | +112% |
List My Property
Real Estate Statistics
Financing Solutions
Browsing History
25 Frederick St, Orillia
6 seconds ago
54 Fitton Hts, Orillia
11 seconds ago
442 Forest Ave, Orillia
14 seconds ago
AS SEEN ON


Are You a Licensed Real Estate Agent or Broker?