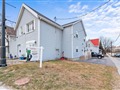
439 Peter St
$796,231
Comparative Market Analysis
Jul 1, 2025
NOT AN ACTIVE LISTING
Historical Performance
| Period | $ Change | % Change |
| 1 Day | +$286 | +0.036% |
| 7 Days | +$282 | +0.035% |
| 30 Days | -$1,325 | -0.166% |
| 3 Months | -$3,091 | -0.387% |
| 6 Months | +$10.6k | +1.35% |
| 1 Year | -$41.3k | -4.94% |
| 3 Years | +$170k | +27.1% |
| 5 Years | +$331k | +71.3% |
| 10 Years | +$495k | +164% |
List My Property
Real Estate Statistics
Financing Solutions
AS SEEN ON


Are You a Licensed Real Estate Agent or Broker?