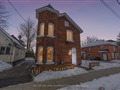
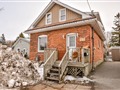
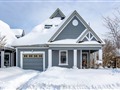
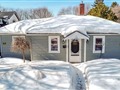
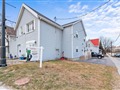
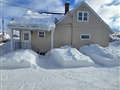
263 Oxford St
$588,497
Comparative Market Analysis
Jul 1, 2025
NOT AN ACTIVE LISTING
Historical Performance
| Period | $ Change | % Change |
| 1 Day | +$211 | +0.036% |
| 7 Days | +$418 | +0.071% |
| 30 Days | +$50 | +0.008% |
| 3 Months | +$1,098 | +0.187% |
| 6 Months | +$14.9k | +2.60% |
| 1 Year | -$13.6k | -2.26% |
| 3 Years | +$149k | +34.0% |
| 5 Years | +$258k | +78.2% |
| 10 Years | +$401k | +214% |
List My Property
Real Estate Statistics
Financing Solutions
Browsing History
349 Victoria Cres, Orillia
6 seconds ago
3197 Bass Lake Side Rd, Orillia
11 seconds ago
AS SEEN ON


Are You a Licensed Real Estate Agent or Broker?