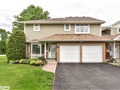
25 South St 116
$336,251
Comparative Market Analysis
May 12, 2025
NOT AN ACTIVE LISTING
Historical Performance
| Period | $ Change | % Change |
| 1 Day | +$135 | +0.040% |
| 7 Days | +$216 | +0.064% |
| 30 Days | -$302 | -0.090% |
| 3 Months | -$897 | -0.266% |
| 6 Months | +$4,553 | +1.37% |
| 1 Year | -$16.7k | -4.74% |
| 3 Years | +$51.8k | +18.2% |
| 5 Years | +$88.9k | +35.9% |
| 10 Years | +$175k | +109% |
List My Property
Real Estate Statistics
Financing Solutions
AS SEEN ON


Are You a Licensed Real Estate Agent or Broker?