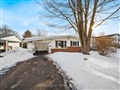
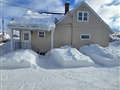
223 Westmount Dr N Dr
$684,912
Comparative Market Analysis
Jul 1, 2025
NOT AN ACTIVE LISTING
Historical Performance
| Period | $ Change | % Change |
| 1 Day | +$246 | +0.036% |
| 7 Days | +$524 | +0.077% |
| 30 Days | +$250 | +0.036% |
| 3 Months | +$1,942 | +0.284% |
| 6 Months | +$18.9k | +2.84% |
| 1 Year | -$11.8k | -1.70% |
| 3 Years | +$189k | +38.2% |
| 5 Years | +$319k | +87.2% |
| 10 Years | +$460k | +205% |
List My Property
Real Estate Statistics
Financing Solutions
Browsing History
351 Tallwood Dr, Orillia
6 seconds ago
138 Memorial Ave, Orillia
6 seconds ago
AS SEEN ON


Are You a Licensed Real Estate Agent or Broker?