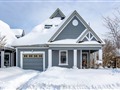
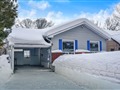
131 Westmount Dr N Dr
$844,524
Comparative Market Analysis
Jul 1, 2025
NOT AN ACTIVE LISTING
Historical Performance
| Period | $ Change | % Change |
| 1 Day | +$303 | +0.036% |
| 7 Days | +$501 | +0.059% |
| 30 Days | -$385 | -0.046% |
| 3 Months | +$311 | +0.037% |
| 6 Months | +$19.5k | +2.36% |
| 1 Year | -$21.6k | -2.50% |
| 3 Years | +$189k | +28.7% |
| 5 Years | +$279k | +49.5% |
| 10 Years | +$478k | +131% |
List My Property
Real Estate Statistics
Financing Solutions
Browsing History
123 Westmount Dr N Dr, Orillia
6 seconds ago
330 Brewery Lane, Orillia
11 seconds ago
17 Michelle Dr, Orillia
15 seconds ago
AS SEEN ON


Are You a Licensed Real Estate Agent or Broker?