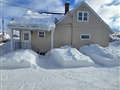
120 Westmount Dr N Dr
$564,296
Comparative Market Analysis
Jul 1, 2025
NOT AN ACTIVE LISTING
Historical Performance
| Period | $ Change | % Change |
| 1 Day | +$203 | +0.036% |
| 7 Days | +$422 | +0.075% |
| 30 Days | +$154 | +0.027% |
| 3 Months | +$1,407 | +0.250% |
| 6 Months | +$15.1k | +2.75% |
| 1 Year | -$11.2k | -1.94% |
| 3 Years | +$150k | +36.2% |
| 5 Years | +$258k | +84.3% |
| 10 Years | +$391k | +226% |
List My Property
Real Estate Statistics
Financing Solutions
Browsing History
413 Victoria Cres, Orillia
5 seconds ago
41 Michelle Dr, Orillia
8 seconds ago
AS SEEN ON


Are You a Licensed Real Estate Agent or Broker?