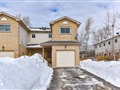
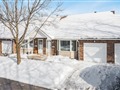
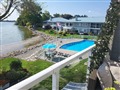
12 Lankin Blvd 20
$440,108
Comparative Market Analysis
May 12, 2025
NOT AN ACTIVE LISTING
Historical Performance
| Period | $ Change | % Change |
| 1 Day | +$176 | +0.040% |
| 7 Days | +$292 | +0.066% |
| 30 Days | -$346 | -0.079% |
| 3 Months | -$1,009 | -0.229% |
| 6 Months | +$6,317 | +1.46% |
| 1 Year | -$21.0k | -4.56% |
| 3 Years | +$71.0k | +19.2% |
| 5 Years | +$121k | +37.9% |
| 10 Years | +$233k | +112% |
List My Property
Real Estate Statistics
Financing Solutions
AS SEEN ON

Are You a Licensed Real Estate Agent or Broker?