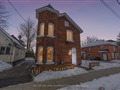
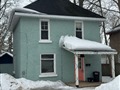
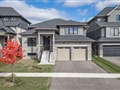
113 Andrew St
$1,016,984
Comparative Market Analysis
May 12, 2025
NOT AN ACTIVE LISTING
Historical Performance
| Period | $ Change | % Change |
| 1 Day | +$365 | +0.036% |
| 7 Days | +$361 | +0.035% |
| 30 Days | -$1,693 | -0.166% |
| 3 Months | -$3,948 | -0.387% |
| 6 Months | +$13.5k | +1.35% |
| 1 Year | +$583k | +134% |
| 3 Years | +$791k | +351% |
| 5 Years | +$823k | +423% |
| 10 Years | +$891k | +707% |
List My Property
Real Estate Statistics
Financing Solutions
AS SEEN ON


Are You a Licensed Real Estate Agent or Broker?