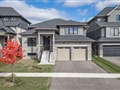
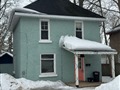
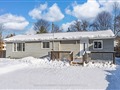
101 Westmount Dr N Dr
$629,869
Comparative Market Analysis
Jul 1, 2025
NOT AN ACTIVE LISTING
Historical Performance
| Period | $ Change | % Change |
| 1 Day | +$226 | +0.036% |
| 7 Days | +$362 | +0.058% |
| 30 Days | -$364 | -0.058% |
| 3 Months | -$195 | -0.031% |
| 6 Months | +$13.1k | +2.12% |
| 1 Year | -$21.4k | -3.29% |
| 3 Years | +$136k | +27.5% |
| 5 Years | +$236k | +60.1% |
| 10 Years | +$392k | +165% |
List My Property
Real Estate Statistics
Financing Solutions
Browsing History
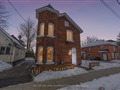
344 Linwood Ave, Orillia
3 seconds ago
AS SEEN ON


Are You a Licensed Real Estate Agent or Broker?